使用 Prometheus 追踪指标
Prometheus 提供了一个强大的实时监控解决方案,使您能够有效地跟踪关键指标并保持系统稳定性。本主题将指导您完成将 Prometheus 与 Databend Cloud 集成的步骤,并概述可用的指标。
使用 Prometheus 追踪指标仅适用于 Databend Cloud 中 业务版 和 独享版 的用户。
与 Prometheus 集成
按照以下步骤设置一个带有 Docker 的 Prometheus 实例,并将其与 Databend Cloud 集成:
前提条件
-
要开始追踪指标,请确保为您的 Databend Cloud 租户启用了指标。要启用此功能,请在 Databend Cloud 中提交支持工单,方法是导航到 支持 > 创建新工单,并请求为您的租户激活指标。
-
此过程说明了如何使用 Docker 设置 Prometheus 实例。在继续之前,请确保您的机器上已安装 Docker Engine。
准备一个 SQL 用户
在 Databend Cloud 中创建一个专用的 SQL 用户,供 Prometheus 访问指标。例如,您可以使用以下 SQL 语句创建一个名为 metrics,密码为 metrics_password 的 SQL 用户:
CREATE USER metrics IDENTIFIED BY 'metrics_password';
使用 Docker 启动 Prometheus
- 在您的本地机器上,创建一个名为 prometheus.yml 的文件,以配置 Prometheus 从 Databend Cloud 抓取指标。使用以下模板:
scrape_configs:
  - job_name: databend-cloud
    scheme: https
    metrics_path: /metrics
    basic_auth:
      username: <USERNAME>
      password: <PASSWORD>
    scrape_interval: 10s
    scrape_timeout: 3s
    static_configs:
      - targets:
          - <TENANT_ENDPOINT>
        labels: # Optional
          tenant: <TENANT_ID>
          platform: <PLATFORM>
          region: <REGION>
| 占位符 | 描述 | 示例 |
|---|---|---|
<USERNAME> | SQL 用户的用户名。 | metrics |
<PASSWORD> | SQL 用户的安全密码。 | metrics_password |
<TENANT_ENDPOINT> | 您的 Databend Cloud 租户的端点 URL。 | tnxxxxxxx.gw.aws-us-east-2.default.databend.com |
<TENANT_ID> | 您的租户的唯一标识符。 | tnxxxxxxx |
<PLATFORM> | 托管租户的云平台。 | aws |
<REGION> | 租户所在的区域。 | us-east-2 |
- 使用以下命令启动 Prometheus(将
</path/to/prometheus.yml>替换为您的 prometheus.yml 文件的完整路径):
docker run -d \
  --name prometheus \
  -p 9090:9090 \
  -v </path/to/prometheus.yml>:/etc/prometheus/prometheus.yml \
  prom/prometheus
- 在浏览器中打开 Prometheus,地址为
http://localhost:9090,导航到 Status > Target health,并确认databend-cloud目标已列出,状态为UP。

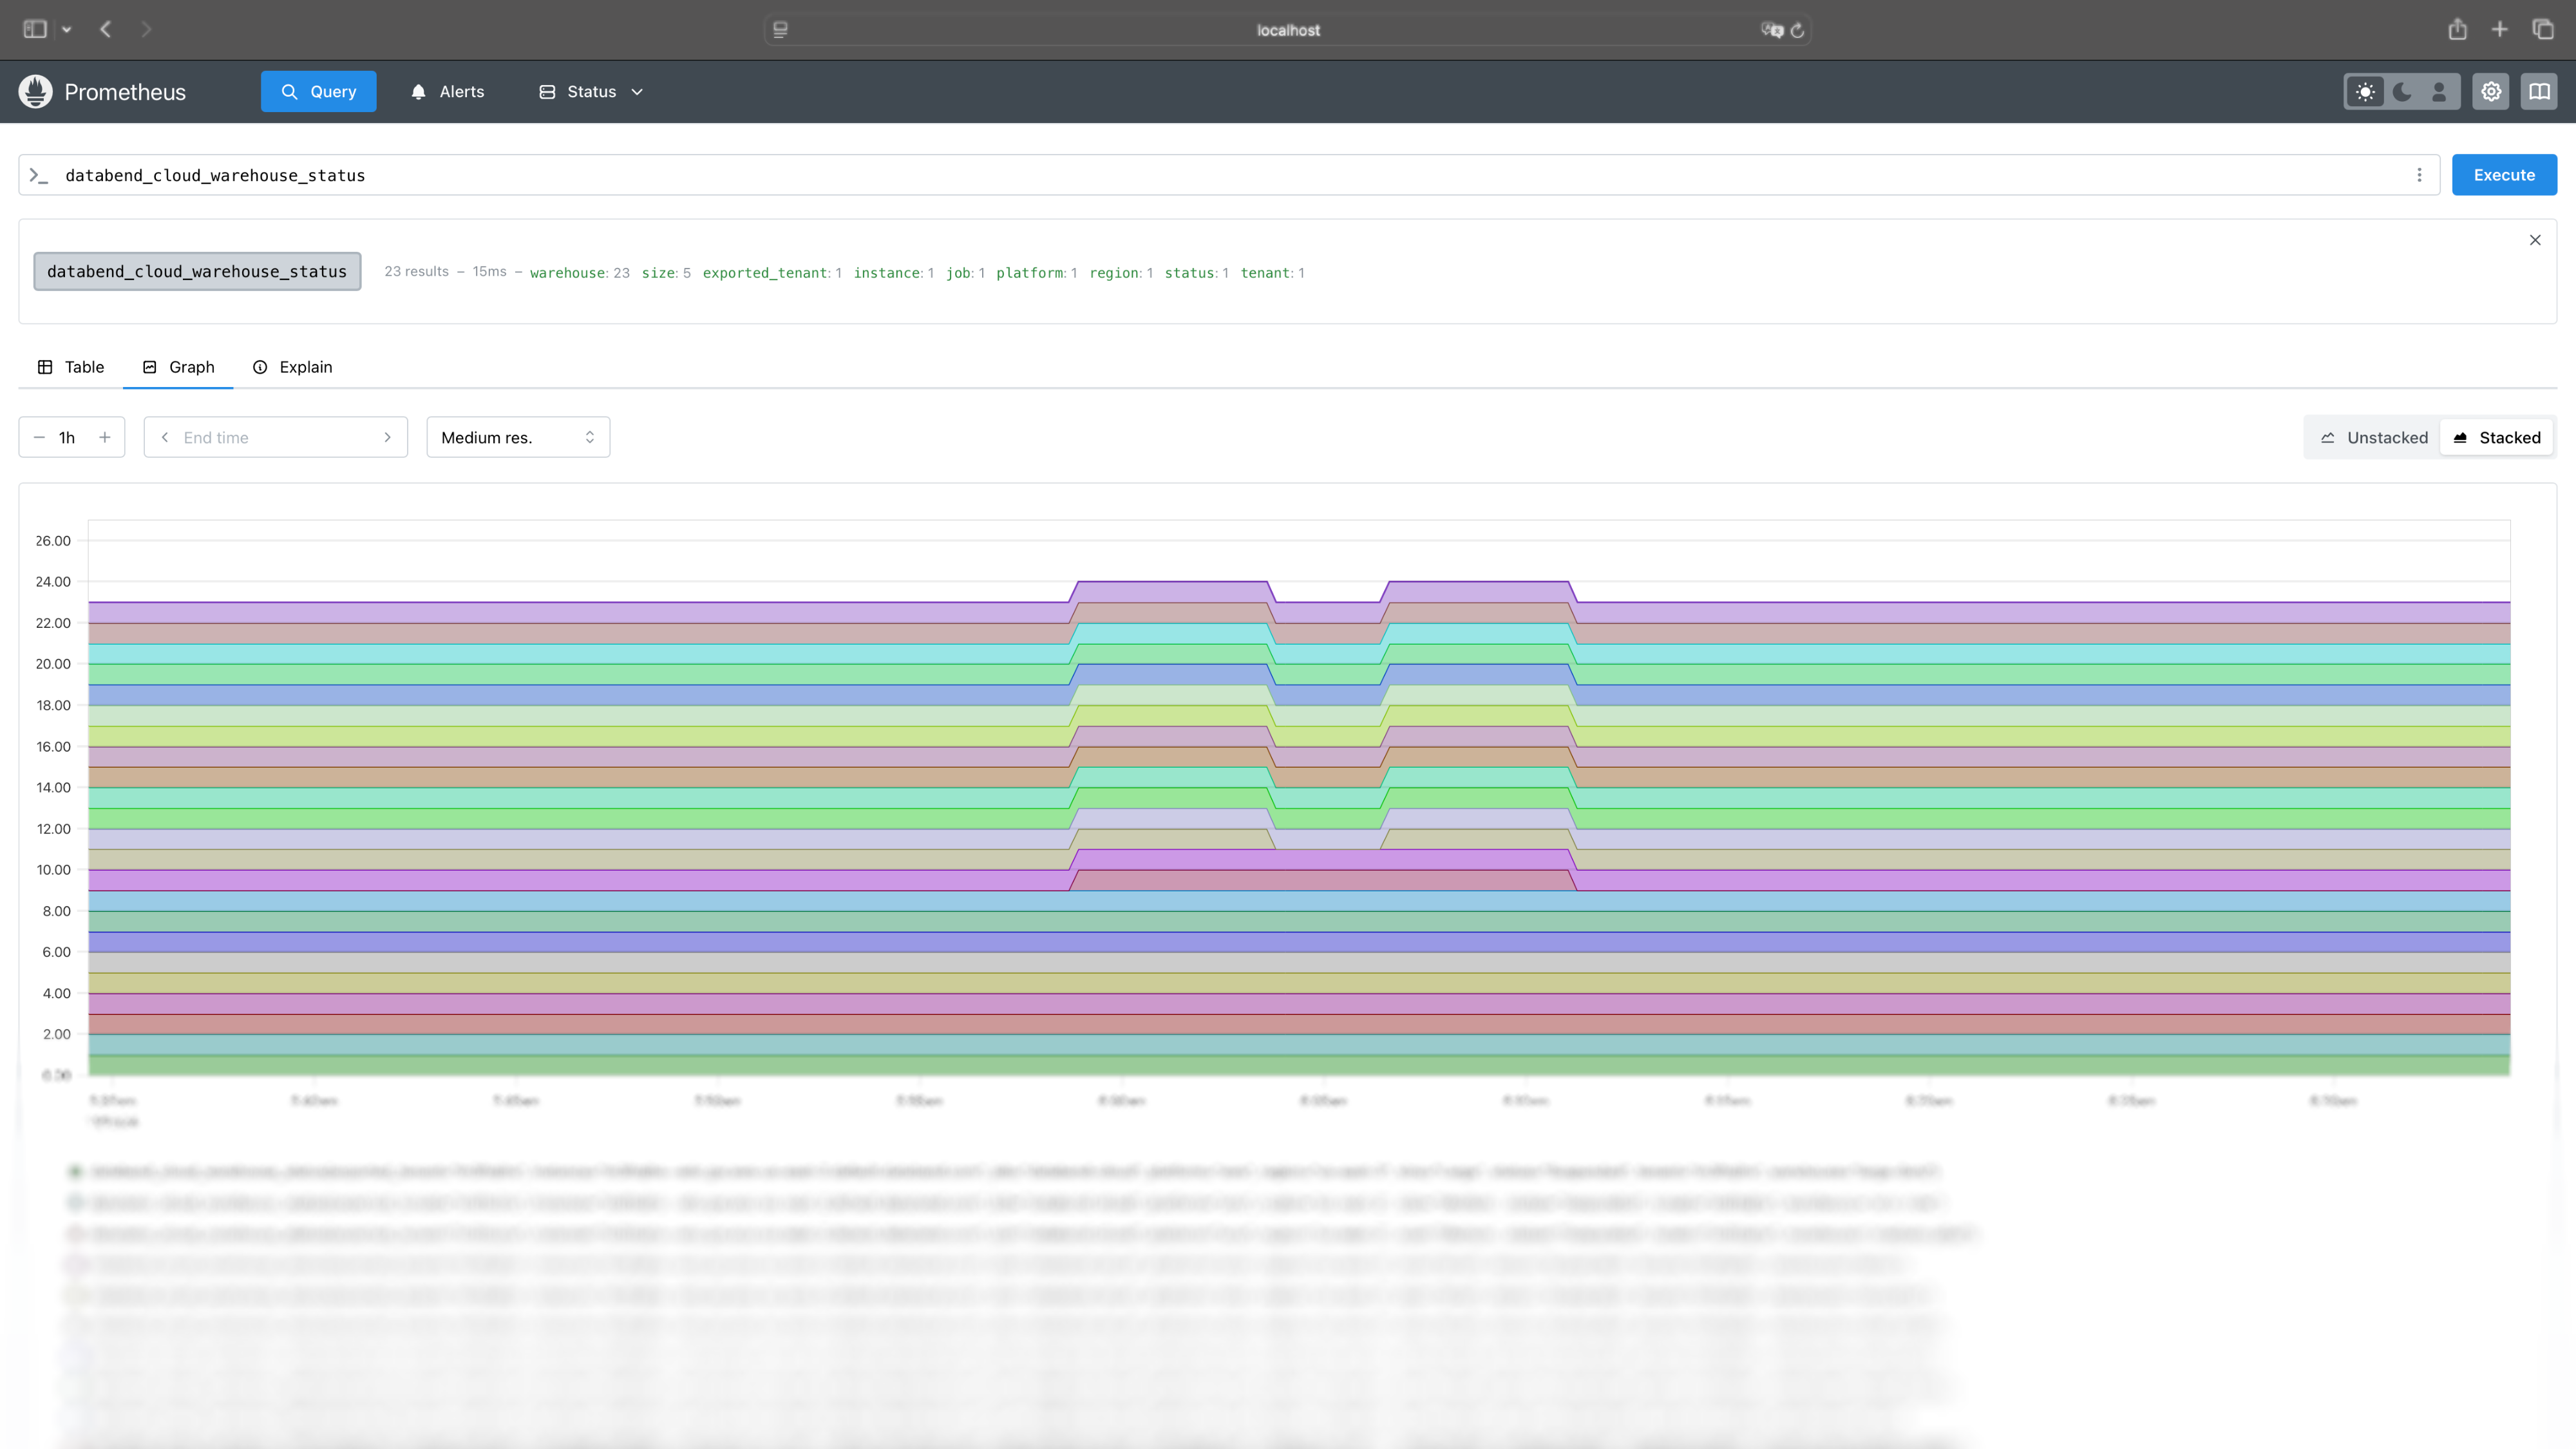
一切就绪!您现在可以直接从 Prometheus 查询您的租户指标。例如,尝试查询 databend_cloud_warehouse_status:
可用指标列表
请注意,所有指标都以 databend_cloud_ 为前缀。
这些指标处于 alpha 状态,可能会随时间而变化。我们建议您密切监控这些指标,并相应地调整您的监控设置。
查询指标
以下是 Databend Cloud 中可用的查询指标列表:
| 名称 | 类型 | 标签 | 描述 |
|---|---|---|---|
| query_count | Counter | tenant,warehouse | 客户端发出的查询计数 |
| query_errors | Counter | tenant,warehouse | 客户端发出的查询错误计数 |
| query_request_bytes | Counter | tenant,warehouse | 来自客户端的查询请求字节数 |
| query_response_bytes | Counter | tenant,warehouse | 发送到客户端的查询响应字节数 |
存储指标
以下是 Databend Cloud 中可用的存储指标列表:
| 名称 | 类型 | 标签 | 描述 |
|---|---|---|---|
| storage_total_size | Guage | tenant | 后端对象存储的总大小 |
| storage_staged_size | Guage | tenant | 后端对象存储上暂存文件的总大小 |
| storage_table_compressed_size | Guage | tenant | 当前表后端对象存储的总大小 |
| storage_non_current_size | Guage | tenant | 后端存储中非当前对象的总大小 |
计算集群 指标
以下是 Databend Cloud 中可用的 计算集群 指标列表:
| 名称 | 类型 | 标签 | 描述 |
|---|---|---|---|
| warehouse_status | Guage | tenant,warehouse,size,status | 计算集群 状态的标志(Suspended,Running 等) |
| warehouse_connections | Guage | tenant,warehouse | 当前会话数 |
| warehouse_queries_queued | Guage | tenant,warehouse | 当前在队列中等待的查询 |
| warehouse_queries_running | Guage | tenant,warehouse | 当前正在运行的查询 |
| warehouse_queries_start_total | Counter | tenant,warehouse | 启动的查询总数 |
| warehouse_queries_failed_total | Counter | tenant,warehouse | 失败的查询总数 |
| warehouse_queries_success_total | Counter | tenant,warehouse | 成功的查询总数 |
| warehouse_storage_requests_total | Counter | tenant,warehouse,scheme,op | 后端存储的请求计数 |
| warehouse_storage_requests_bytes | Counter | tenant,warehouse,scheme,op | 来自后端存储的请求字节数 |
| warehouse_data_scan_rows | Counter | tenant,warehouse | 从后端存储扫描的数据行数 |
| warehouse_data_write_rows | Counter | tenant,warehouse | 写入后端存储的数据行数 |
任务指标
以下是 Databend Cloud 中可用的任务指标列表:
| 名称 | 类型 | 标签 | 描述 |
|---|---|---|---|
| task_scheduled_total | Counter | tenant,task | 计划任务总数 |
| task_query_requests_total | Counter | tenant,task | 任务的查询请求 |
| task_run_skipped_total | Counter | tenant,task | 跳过的任务运行 |
| task_accessor_requests_total | Counter | tenant,function | 任务的访问器请求 |
| task_notification_success_total | Counter | tenant | 成功的任务通知 |
| task_notification_errors_total | Counter | tenant | 任务通知错误 |
| task_running_duration_seconds | Counter | tenant,task | 任务运行持续时间(秒) |
| task_running | Counter | tenant,task | 正在运行的任务 |
| task_scheduled_timestamp | Counter | tenant,task | 计划任务时间戳 |